Technology acceptance model questionnaire: 38 TAM survey items
A TAM questionnaire asks the people using one tool whether it helps their work (perceived usefulness), whether it is easy (perceived ease of use) and whether they will keep using it. The 12-item core scores those constructs; add modules for a pre-launch baseline, UTAUT support factors or a thesis.
- 38items
- 12in the TAM core
- 3 minto answer the core
- 5constructs scored
By Michael Hodge, BSc Psychology Updated September 2026
All 38 TAM questionnaire items
The TAM core is ticked. Add a module for a pre-launch baseline, a UTAUT-style rollout study, training feedback or a research model, or pick single items. Each row shows its answer scale and the construct it measures.
TAM core: usefulness, ease, intention and use12 questions
Four usefulness statements, four on ease of use, one on attitude and one on intention, then weekly use and an open question. Replace "this tool" with the name of your system before you send it.
-
This tool helps me get my work done faster.
Strongly disagree12345Strongly agree1 = Strongly disagree, 5 = Strongly agreePerceived usefulness, first angle: speed. Read items 1 to 4 together as one usefulness score.1
-
The work I produce is better since I started using this tool.
Strongly disagree12345Strongly agree1 = Strongly disagree, 5 = Strongly agreeUsefulness as quality rather than speed. A tool can be fast and still make the output worse.
-
This tool saves me effort on the tasks that matter most to me.
Strongly disagree12345Strongly agree1 = Strongly disagree, 5 = Strongly agreeTies usefulness to the tasks people care about, not the features the vendor lists.
-
Overall, this tool is useful for the work I do.
Strongly disagree12345Strongly agree1 = Strongly disagree, 5 = Strongly agreeThe summary usefulness item. If it is low while the first three are high, a key task is missing.
-
I picked up the basics of this tool quickly.
Strongly disagree12345Strongly agree1 = Strongly disagree, 5 = Strongly agreePerceived ease of use, first angle: learning. Items 5 to 8 make the ease score.1
-
I can get this tool to do what I need without workarounds.
Strongly disagree12345Strongly agree1 = Strongly disagree, 5 = Strongly agreeEase in daily use. Low agreement points to settings, permissions or missing steps.
-
The steps in this tool make sense to me.
Strongly disagree12345Strongly agree1 = Strongly disagree, 5 = Strongly agreeClarity of the screens and flow. It often recovers once people have had a month of practice.
-
Using this tool takes little mental effort.
Strongly disagree12345Strongly agree1 = Strongly disagree, 5 = Strongly agreeEffort is the core of ease of use. A tool that works but tires people out gets dropped.
-
I like having this tool as part of my day.
Strongly disagree12345Strongly agree1 = Strongly disagree, 5 = Strongly agreeAttitude toward using it. In some studies it moves almost in step with usefulness, so check the correlation before you report both.4
-
I will keep using this tool over the next three months.
Strongly disagree12345Strongly agree1 = Strongly disagree, 5 = Strongly agreeBehavioural intention, the outcome the model predicts. Compare it with the usefulness and ease scores.
-
In a typical week, how often do you use this tool?
Not at allOnce or twiceA few timesDailyMany times a daySelf-reported use. Intention and real use can differ, so ask both, and match it to log data if you have it.1
-
What would make this tool more useful or easier for you?
Open answerThe fix list in users' own words. Sort the answers into usefulness and ease piles to match the scores.
Before launch (after a demo or trial)5 questions
Send these to the same people before go-live, after they have seen the tool. They give you a baseline to compare with the core at one and three months.
-
From what I have seen, this tool will help me do my job better.
Strongly disagree12345Strongly agree1 = Strongly disagree, 5 = Strongly agreeExpected usefulness before real use. A big drop after launch means the demo oversold it.2
-
From the demo, this tool looks easy to pick up.
Strongly disagree12345Strongly agree1 = Strongly disagree, 5 = Strongly agreeExpected ease. Compare it with the ease items at one month to see whether training closed the gap.
-
I am looking forward to switching to this tool.
Strongly disagree12345Strongly agree1 = Strongly disagree, 5 = Strongly agreeEarly attitude. A low score here tells you who to involve in the pilot.
-
Once the tool is available, when do you expect to start using it?
Straight awayWithin a monthOnly when requiredNot sureSeparates early adopters from people waiting for a mandate, so you know who to ask for help with the rollout.
-
What concerns you most about moving to this tool?
Open answerConcerns raised before launch are cheap to answer. The same ones raised after launch cost goodwill.
Support and social influence (UTAUT additions)6 questions
For organisation-wide rollouts. These cover the conditions around the tool: management backing, peers, access, help and fit with other software.
-
My manager wants our team to use this tool.
Strongly disagree12345Strongly agree1 = Strongly disagree, 5 = Strongly agreeSocial influence from above, one of the four UTAUT determinants of intention.3
-
Colleagues I respect use this tool themselves.
Strongly disagree12345Strongly agree1 = Strongly disagree, 5 = Strongly agreePeer influence, the social side of TAM2. Read it next to the manager item to see where the push comes from.2
-
I have the device, access and licences this tool needs.
Strongly disagree12345Strongly agree1 = Strongly disagree, 5 = Strongly agreeFacilitating conditions, the practical side. Missing access looks like resistance in the other scores.3
-
When I get stuck, I know who can help me with this tool.
Strongly disagree12345Strongly agree1 = Strongly disagree, 5 = Strongly agreeSupport you can reach. In one hospital study, support conditions outpredicted every other factor.4
-
This tool works well with the other software I use.
Strongly disagree12345Strongly agree1 = Strongly disagree, 5 = Strongly agreeFit with the rest of the stack. Double entry between systems wears down ease of use.
-
Is using this tool your choice?
Fully my choicePartly my choiceRequired for my roleVoluntariness. Report the scores separately for people who chose the tool and people who must use it.2
Training and rollout6 questions
For the team running the rollout. These find out how people learned the tool, what is still in the way and what help they want next.
-
How did you mainly learn to use this tool?
Formal trainingA colleagueVideos or help pagesTrial and errorShows which channel really taught people. Put the next budget into that one.
-
The training covered the tasks I actually do in this tool.
Strongly disagree12345Strongly agree1 = Strongly disagree, 5 = Strongly agreeTraining that shows every feature but skips daily tasks leaves ease-of-use scores low.
-
I understand why we moved to this tool.
Strongly disagree12345Strongly agree1 = Strongly disagree, 5 = Strongly agreePeople who know the reason for a change rate its usefulness more fairly.
-
What gets in the way of using this tool more?
No timeHard to learnMissing featuresSlow or unreliableUnclear benefitNothingTick all that applyThe blocker list. Each answer maps to a construct: time and learning to ease, features and benefit to usefulness.
-
What extra help would be most useful now?
NoneA short refresherA hands-on sessionA go-to expertLets people choose the format, so the next session is one they will attend.
-
Which task do you still do outside this tool, and why?
Open answerFinds the workarounds that keep old systems alive after launch.
Extended TAM for research projects6 questions
For theses and published studies that test TAM2 or TAM3 paths. Each item adds one construct that explains why the tool seems useful or easy.
-
This tool covers the parts of my role that matter most.
Strongly disagree12345Strongly agree1 = Strongly disagree, 5 = Strongly agreeJob relevance, a TAM2 driver of usefulness.2
-
I trust the results this tool gives me.
Strongly disagree12345Strongly agree1 = Strongly disagree, 5 = Strongly agreeOutput quality, another TAM2 driver. Low trust caps usefulness however fast the tool is.2
-
I could explain to a colleague what this tool has changed for me.
Strongly disagree12345Strongly agree1 = Strongly disagree, 5 = Strongly agreeResult demonstrability. Benefits people can point to spread faster than ones they cannot name.2
-
I could finish a task in this tool with nobody around to help.
Strongly disagree12345Strongly agree1 = Strongly disagree, 5 = Strongly agreeComputer self-efficacy: confidence to work the tool alone. Low scores point to support, not redesign.
-
I feel relaxed when I use this tool.
Strongly disagree12345Strongly agree1 = Strongly disagree, 5 = Strongly agreeThe positive side of computer anxiety. Worded so agreeing is good, like the core.
-
I enjoy the time I spend in this tool.
Strongly disagree12345Strongly agree1 = Strongly disagree, 5 = Strongly agreePerceived enjoyment. Useful when the tool is optional and competes with an older habit.
About you (optional)3 questions
Experience, age and gender are the moderators UTAUT tests. Report a split only when each group has enough people to stay anonymous.
-
How long have you used this tool?
Not yetUnder a month1 to 6 monthsOver 6 monthsExperience is a UTAUT moderator, so compare new users with people who have used the tool for months.3
-
How old are you?
Under 2525 to 3435 to 4445 to 5455 or olderAn age moderator in UTAUT. Wide bands keep people anonymous.3
-
What is your gender?
WomanManAnother identityPrefer not to sayThe gender moderator in UTAUT, for studies that test it.3
TAM constructs and how to score them
Each core item belongs to one construct. Score the construct, not the single item.
| Construct | What it captures | Core items |
|---|---|---|
| Perceived usefulness | Belief that the tool improves your work | 1 to 4 |
| Perceived ease of use | Belief that using it is free of effort | 5 to 8 |
| Attitude | How you feel about using it | 9 |
| Intention to use | Plans to keep using it | 10 |
| Use | How often you use it now | 11 |
Score each construct as an average
Code the answers 1 (strongly disagree) to 5 (strongly agree). For each person, average items 1 to 4 for usefulness and items 5 to 8 for ease of use, then average those scores across the group.
A worked example
Say 40 people rate a new booking system. Their four usefulness items average 4.1, 3.9, 4.2 and 3.8, so usefulness is 4.0. The ease items average 3.1, 2.9, 3.4 and 3.0, so ease of use is 3.1. People see the value but find the system hard work. Fix setup and training before you add features, then send the core again in a month.
Check reliability before you report
For a thesis or paper, report Cronbach's alpha for each construct. Davis's original six-item scales reached .98 for usefulness and .94 for ease of use.1 If you need his exact items for a replication, take them from the 1989 paper and cite it. The items on this page are newly written and measure the same ideas.
Printable TAM questionnaire and scoring sheet
Handy for a pilot group, a training room or a thesis sample that answers on paper. Each PDF fits US letter or A4.
Want your own selection on paper? Tick the questions above and .
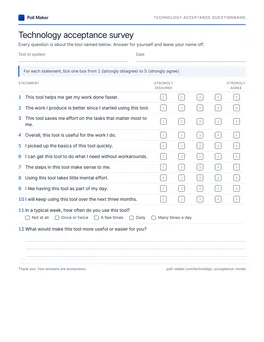
TAM questionnaire
A line for the tool name, the 12 core items with tick boxes, then the launch, support, training, research and About you modules. Skip the modules you are not using.
Download PDF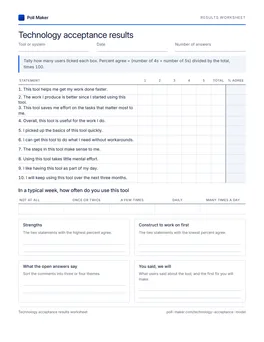
Scoring sheet
Tally weekly use and each core statement, work out the share agreeing, and mark the construct to fix first.
Download PDFRunning a TAM survey that predicts real use
The model is simple. Four choices decide whether your scores explain what people actually do with the tool.

Rate one named tool, never "technology"
TAM measures beliefs about a specific system. Ask about "technology" in general and people average their laptop, their phone and the tool you care about into one blurred score. Put the tool's name in the paper header and swap it into every item in the builder. Studying two tools? Send two surveys, one per tool.
How strongly each belief tracked use of the tool
Give usefulness more weight than ease
In the study that created the model, usefulness tracked use more closely than ease of use did: a correlation of .63 against .45 with current use, and .85 against .59 with predicted use.1 Davis also found that ease may work through usefulness. A tool people find easy but pointless still gets dropped, so read the usefulness score first.

Measure before launch, then at one and three months
TAM2 was tested by asking users at four organisations before the system went live, one month after and three months after.2 Copy that rhythm. Send the Before launch module after the demo, then the core twice. The change between rounds tells you whether training and fixes worked.

Ask about the help around the tool
Beliefs about the tool are not the whole story. In a hospital study of a telemonitoring system, usefulness was the only significant predictor of intention in plain TAM, but once support conditions were added they became the only significant one.4 The Support and social influence module covers access, help, management backing and fit with other software.
At a rollout meeting, a single question gets a read of the room in seconds. Run the start-date question as a live poll and project the results. Sharing by QR code or embed is explained in our poll how-to.
Chart acceptance item by item
Enter how many people chose each point on the ten core statements. A high score is good on every one of them, so the shortest bar shows which belief is holding the tool back.
- 1Tally each answer point for every statement. The bar length is the proportion of 4s and 5s.
- 2Group the bars by construct: statements 1 to 4 are usefulness, 5 to 8 are ease of use. A whole group of short bars is a construct problem, not a wording one.
- 3Low usefulness calls for better use cases and a clear reason for the change. Low ease calls for setup fixes and hands-on training.
- 4Send the core again after the fix, then show the people who answered how the two rounds compare.
TAM core results
TAM, TAM2 or UTAUT: picking a model for your study
All three start from usefulness and ease of use. They differ in what they add around them.
| Model | Adds | Pick it when |
|---|---|---|
| TAM (Davis, 1989) | Usefulness and ease of use predicting intention and use | One system, a short survey, a clear baseline |
| TAM2 (2000) | Social influence, voluntariness, image, job relevance, output quality, result demonstrability | You measure before and after launch, or use is required for some people |
| UTAUT (2003) | Facilitating conditions and social influence, with age, gender, experience and voluntariness as moderators | A rollout across an organisation where support decides success |
More constructs usually explain more. In the UTAUT study, eight earlier models explained between 17% and 53% of the variance in intention to use; the unified model reached 69%, and 70% in two new organisations.3 TAM2 explained 34% to 52% of the variance in usage intentions across four systems.2 Each extra construct also adds items, so add a module only when your research question needs it.
On this page, the core is TAM. Add Extended TAM for the TAM2 drivers, or Support and social influence plus About you for a UTAUT-style design. For the wider business case around a new platform, pair it with the digital transformation survey. More rollout and research sets sit under business survey questions.
A five-item acceptance check after go-live
One usefulness item, one ease item, intention, weekly use and the open fix question. Send it a month after launch when a full TAM survey would be too much.
- 01Overall, this tool is useful for the work I do.
- 02Using this tool takes little mental effort.
- 03I will keep using this tool over the next three months.
- 04In a typical week, how often do you use this tool?
- 05What would make this tool more useful or easier for you?
Weak acceptance questions, rewritten
Most home-made TAM surveys trip on the same four problems. The survey question guide covers the general rules.
Is this technology useful and easy to use?
Overall, this tool is useful for the work I do.
Using this tool takes little mental effort.
Two constructs in one item. TAM scores them apart because they predict use differently.
How do you feel about technology at work?
I like having this tool as part of my day.
Acceptance is about one system. A general attitude to technology cannot tell you what to fix.
Would you use the system more if it were simpler?
I will keep using this tool over the next three months.
A hypothetical with the answer built in. Intention should be a plain statement about the person's own plans.
Don't you agree the new system saves time?
This tool helps me get my work done faster.
The first wording signals what you hope to hear. Plain wording on an agree scale leaves room to disagree.
TAM questionnaire questions, answered
For student researchers, analysts and rollout leads.
What is the technology acceptance model questionnaire?
A survey that measures the two beliefs Davis found drive whether people take up a system: perceived usefulness and perceived ease of use. Most versions add intention to use and a question on actual use. Davis's original had two six-item scales.
How many items does a TAM questionnaire have?
The original has 12, six per construct. Most studies add two or three intention items and a use question, so 15 to 20 is typical. The core here has 12, and 38 with every module.
What rating scale does the TAM questionnaire use?
Davis used seven-point scales: agree to disagree in his first study, then extremely likely to extremely unlikely, with every point labelled.5 This version uses five-point agree scales, which are quicker on a phone. For an exact replication, keep seven points.
What is the difference between TAM and UTAUT?
TAM uses two beliefs to predict intention. UTAUT renames them performance and effort expectancy, adds social influence and facilitating conditions, and tests age, gender, experience and voluntariness as moderators.
Can I use a TAM survey with students?
Yes. Name the learning platform, change "work" to "coursework" where it reads better, and send it after a few weeks of use. For devices and apps across a whole school, the technology in education survey goes wider.
Find out if your tool is catching on
Name the tool, add the module your rollout or study needs, then send the survey by link or print the paper version for a pilot group.