Free Net Promoter Score Survey
50+ Expert Crafted Net Promoter Score Survey Questions
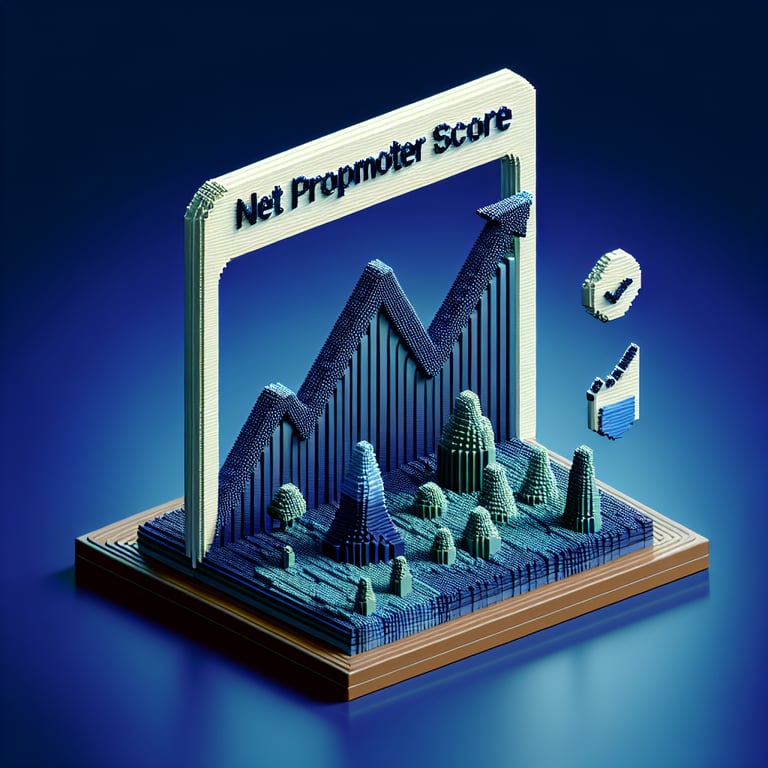
Discover how measuring your Net Promoter Score can spotlight loyal customers and fuel business growth. A Net Promoter Score survey asks how likely your customers are to recommend your brand - providing a simple yet powerful gauge of satisfaction - so we've created a free template preloaded with example questions and optimized for response aggregation byPage. If you'd like to tailor your survey further, head to our online form builder to craft the perfect questionnaire.
Trusted by 5000+ Brands

Top Secrets to Mastering Your Net Promoter Score Survey
Start your journey with a robust Net Promoter Score survey to gauge loyalty and fuel growth. According to Wikipedia, NPS categorizes customers into promoters, passives, and detractors based on their likelihood to recommend your brand. This simple metric predicts long-term loyalty and provides a clear benchmark for improvement. Knowing your base score is the first step toward strategic action and sustainable success.
Imagine a small SaaS startup that sent the core question "How likely are you to recommend us to a friend?" after a trial and saw a 20% boost in referral traffic within a quarter. Following that, they added one follow-up: "What do you value most about our service?" to gather qualitative insights. This real-world approach echoes SurveyMonkey's advice in 50 NPS Survey Questions With Examples and Templates, emphasizing clarity and brevity to keep response rates high.
Focus on brevity: 2 - 6 questions are ideal, as CustomerGauge recommends for statistical significance and user engagement. A finely tuned sequence can prevent survey fatigue and maintain accuracy in your data. Use targeted segments to drill down on specific groups - promoters, passives, and detractors - to tailor follow-up actions. Keep your audience in mind and design a seamless experience.
Ready to deploy? Launch a quick poll that captures the essentials, then dive into detailed segments with your NPS Survey and Net Promoter Survey templates. When you master these top secrets, your feedback engine becomes a powerful growth driver. Get set to transform insights into action.

5 Must-Know Tips for Your Net Promoter Score Survey
Avoid these common pitfalls to keep your Net Promoter Score survey on track. Many surveys crash response rates when they stray beyond a few key questions or include leading language. In fact, research shows that response rates can drop over 30% if a survey exceeds six questions. Lean on best practices from 10 Tips to Create NPS Surveys to set clear objectives and maintain question clarity.
Be mindful of question wording. Steering customers toward a positive answer or using jargon skews your results. Instead, craft neutral prompts like "What do you value most about our service?" or the standard "How likely are you to recommend us to colleagues?" to get genuine feedback. A concise set of questions helps avoid bias and ensures each response reflects true sentiment.
Timing and delivery matter. Sending your survey at the wrong moment - during peak service issues or outside of engagement windows - can undercut meaningful insights. Explore different channels, from in-app messaging to email and SMS, as outlined by CustomerGauge. Testing variations helps you find the sweet spot for maximum reach and authentic engagement.
Finally, analyze results promptly and segment by key demographics. Use actionable dashboards from Qualtrics to track KPIs, spot trends, and convert insights into targeted improvements. Don't launch until you've designed follow-up workflows for promoters, passives, and detractors. A well-executed NPS survey not only measures loyalty but ignites your path to growth. Start with a simple poll, then deepen the conversation.
Core NPS Survey Questions
Our Core NPS Survey Questions focus on measuring customer loyalty using the definitive Net Promoter Score metric. By asking these targeted inquiries, you can quickly gauge overall satisfaction and identify shifts in promoter and detractor levels through NPS Survey tracking.
-
How likely are you to recommend our company to a friend or colleague?
Asking this directly measures the classic NPS score. It helps determine promoter and detractor percentages, which are crucial for tracking loyalty over time.
-
What is the main reason for your score?
This follow-up uncovers the factors behind the numeric rating. It provides qualitative context that can guide improvements.
-
Which aspects did you enjoy most about our product or service?
Identifying strengths highlights what resonates with customers. This insight helps you reinforce successful features in future offerings.
-
Which areas of our product or service could be improved?
Pinpointing weaknesses reveals opportunities for enhancement. It guides your development roadmap and helps reduce detractor counts.
-
How satisfied are you with the value you received?
Value perception directly influences loyalty and willingness to recommend. It shows if pricing aligns with customer expectations.
-
How would you rate your overall experience with our brand?
This broad question captures general sentiment beyond specific features. It helps compare overall brand health against NPS trends.
-
How does our product or service compare to your expectations?
Gathering expectation data highlights gaps between promise and delivery. Closing these gaps can convert passives into promoters.
-
How has your perception of our brand changed over the last year?
This temporal question tracks shifts in sentiment over time. It helps evaluate the impact of recent initiatives on customer loyalty.
-
How responsive have we been to your questions or concerns?
Customer support quality influences loyalty and recommendations. High responsiveness often correlates with increased promoter scores.
-
How likely are you to continue using our product or service in the future?
Retention intent serves as another loyalty indicator alongside NPS. It predicts future promoter behavior and potential churn risks.
Customer Loyalty Follow-Up Questions
Customer Loyalty Follow-Up Questions dig deeper into the drivers of repeat business and advocacy. Use these to uncover what truly motivates ongoing engagement and to strengthen your Customer Loyalty Survey insights.
-
How do you feel about our loyalty or rewards program?
Understanding program sentiment reveals its effectiveness. Positive feedback can reinforce benefits, while critiques guide new rewards.
-
How valued do you feel by our brand?
Perceived value influences emotional attachment and advocacy. It helps you tailor communication strategies to reinforce that bond.
-
How likely are you to purchase from us again?
Purchase intent measures future loyalty beyond current satisfaction. It flags potential churn or increased repeat business opportunities.
-
What motivates you to choose us over competitors?
Identifying your unique selling points highlights competitive advantages. This insight supports messaging that resonates with prospects.
-
How likely are you to explore additional products or services we offer?
Cross-sell intent indicates receptiveness to new offerings. It helps forecast revenue growth from existing customers.
-
How well do our loyalty benefits meet your needs?
Benefit alignment influences perceived program value. Tailoring perks to customer preferences can boost engagement.
-
What would increase your loyalty to our brand?
Direct suggestions for loyalty drivers guide strategic improvements. Acting on these ideas can convert passives into promoters.
-
How often do you engage with our brand updates or promotions?
Engagement frequency sheds light on communication effectiveness. It helps optimize content cadence for maximum reach.
-
How confident are you in our brand's reliability?
Trust is a cornerstone of loyalty and advocacy. High confidence scores often correlate with stronger promoter behavior.
-
How often do you talk about our brand to others?
Word-of-mouth frequency directly reflects advocacy levels. It offers a grassroots view of genuine promoter activity.
Improvement Feedback Questions
Improvement Feedback Questions aim to collect actionable suggestions that enhance your offerings and address pain points. Pair these with your ongoing Customer Feedback Survey efforts to drive targeted innovation.
-
What features would you like to see added?
Customer-driven feature requests guide your development roadmap. Prioritizing popular suggestions boosts user satisfaction and retention.
-
What improvements would enhance your experience?
General improvement suggestions highlight broad enhancements. Addressing these areas can reduce friction and boost loyalty.
-
What obstacles have you encountered using our product or service?
Identifying pain points uncovers usability or process issues. Resolving these obstacles leads to smoother customer journeys.
-
How can our support team better assist you?
Feedback on support quality informs training and resource allocation. Improved assistance often raises overall satisfaction.
-
What additional resources (guides, tutorials, videos) would be helpful?
Resource requests indicate where customers need more guidance. Providing relevant content empowers users and reduces support tickets.
-
Which communication channels do you prefer for updates?
Channel preferences ensure your messages reach customers effectively. Tailoring communication boosts engagement and information retention.
-
How can we simplify our ordering or subscription process?
Simplification suggestions streamline customer interactions. A smoother process can reduce cart abandonment and churn.
-
What pricing changes would make our offering more valuable?
Pricing feedback reveals perceived value and affordability. Adjusting pricing or packaging can widen your customer base.
-
How can we improve our website or app experience?
User interface feedback highlights design and functionality gaps. Enhancing digital experiences increases satisfaction and loyalty.
-
What suggestions do you have for improving our documentation or tutorials?
Documentation feedback points to areas of confusion or lack of clarity. Better guides empower customers and reduce support load.
Demographic Context Questions
Demographic Context Questions help you segment NPS results and identify trends across customer groups. Integrate these into your broader Customer Research Survey to deepen your audience understanding.
-
Which age group do you belong to?
Age segmentation reveals generational preferences. It helps tailor messaging and product features for different cohorts.
-
What is your occupation or industry?
Industry context informs how customers use your product. This insight guides sector-specific enhancements.
-
How long have you been a customer of ours?
Tenure influences familiarity and satisfaction levels. Tracking this metric uncovers trends in loyalty over time.
-
How frequently do you use our product or service?
Usage frequency correlates with engagement and value perception. High-frequency users often provide deeper feedback.
-
What is the size of your organization?
Organization size helps assess scalability and needs. It ensures solutions align with customer capacity and resources.
-
Which geographic region do you reside in?
Regional data highlights market-specific trends. It informs targeted marketing and localization decisions.
-
What is your primary reason for selecting our product or service?
Understanding purchase drivers refines positioning and messaging. It shows what value propositions resonate most deeply.
-
Do you use competing products or services?
Competitive usage data indicates alternatives customers consider. It can spotlight areas for differentiation.
-
What is your preferred purchase channel (online, in-store, partner)?
Channel preference insights guide distribution strategies. Aligning with preferred channels enhances the purchase experience.
-
What is your budget range for this type of solution?
Budget data informs pricing tiers and packaging. It helps position offerings to match customer spending capacity.
Channel Experience Questions
Channel Experience Questions assess satisfaction across every touchpoint, from digital to in-person interactions. Use these alongside your Customer Experience Survey to ensure consistency and quality across channels.
-
How would you rate the ease of navigating our website?
Website usability affects first impressions and conversion rates. Improving navigation leads to higher satisfaction and engagement.
-
How satisfied are you with our mobile app experience?
App satisfaction reflects mobile-first usability and performance. Refining app features can drive repeat usage and loyalty.
-
How helpful was our customer support chat or helpdesk?
Support chat quality influences immediate resolution and satisfaction. Enhancing responsiveness improves customer trust.
-
How effective was our email communication in keeping you informed?
Email clarity and frequency impact engagement rates. Well-crafted updates foster stronger customer relationships.
-
How responsive are we on social media channels?
Social responsiveness demonstrates real-time engagement. Active social support can delight customers and build advocacy.
-
How satisfied are you with in-store or on-site interactions?
In-person service quality influences overall brand perception. Training staff to meet expectations enhances loyalty.
-
How clear and informative are our product updates and release notes?
Update transparency builds trust and anticipation. Well-communicated changes reduce confusion and support inquiries.
-
How would you rate the checkout or payment process?
Streamlined checkout reduces cart abandonment. Simplifying payments improves satisfaction and conversion.
-
How timely and relevant are our promotional messages?
Promotion relevance affects open rates and engagement. Targeted offers can drive repeat purchases.
-
How seamless is cross-channel continuity (e.g., switching from web to mobile)?
Consistent experiences across channels boost customer confidence. Seamless transitions reduce friction and frustration.