Free Urban Suburban Rural Survey
50+ Expert Crafted Urban Suburban Rural Survey Questions
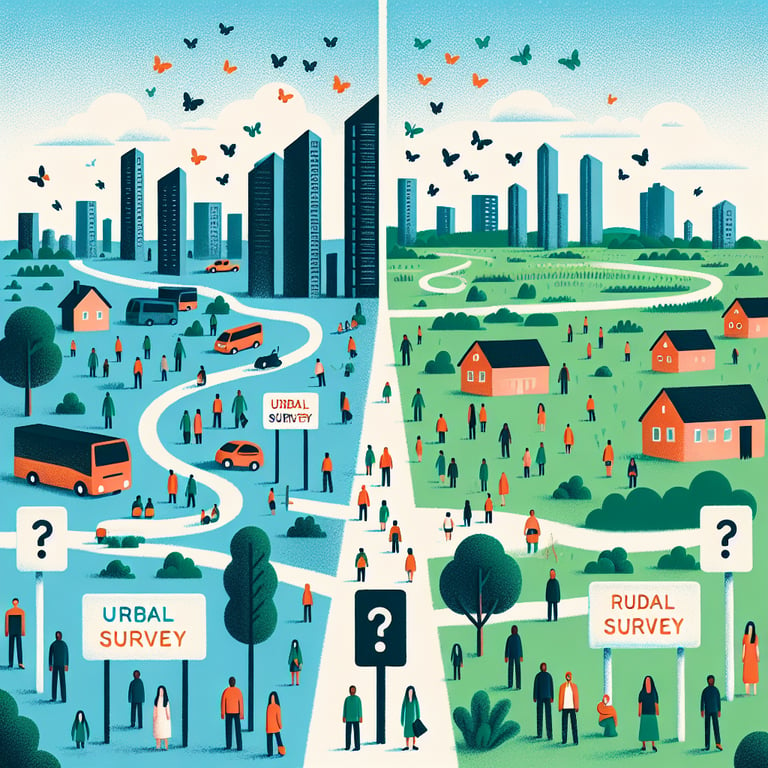
Measuring Urban, Suburban, and Rural populations uncovers critical location-based insights that drive smarter decisions in marketing, policy, and services. An Urban Suburban Rural survey classifies respondents by community type - urban, suburban, or rural - to highlight lifestyle, infrastructure, and demographic trends. Load our free template preloaded with expert-crafted questions or build a tailored questionnaire using our online form builder.
Trusted by 5000+ Brands

Top Secrets for Crafting an Urban Suburban Rural survey That Delivers
When you dig into community opinions, an Urban Suburban Rural survey shines light on real differences. It reveals how city-dwellers, suburban families, and rural neighbors view growth, services, and quality of life. You get clear data on what features drive satisfaction in each setting. That understanding fuels smarter planning and stronger communities.
First, define your scope: urban, suburban, and rural areas often blend at the edges. Use crisp, simple language so respondents know where they fit. Ask direct questions like "What do you value most about living in your neighborhood?" or "What public amenities matter most to you?" These openers uncover priorities and spark honest answers.
Next, lean on proven frameworks. According to the National Center for Health Statistics, the NCHS Urban-Rural Classification Scheme for Counties offers six clear levels. The U.S. Census Bureau's Urban and Rural Classification maps population and housing density. These guides guarantee consistency and credibility - and boost your survey's authority.
Imagine a midwestern planning team launching a poll on transit. They group responses by classification, spot gaps in rural bus routes, and tailor solutions. Their question bank included a mix of multiple choice and open text to capture both trends and stories. That real-world example shows how a well-designed tool tells a powerful local story.
Finally, pilot test your survey. Send a draft to ten neighbors across all three zones. Watch for confusing instructions or vague scales, then refine. Use both online forms and face-to-face interviews to maximize reach. That extra step ensures smooth rollout and higher completion rates.
By following these secrets, you'll turn raw feedback into actionable insights. You'll build a best-in-class Urban Rural Survey that informs budgets, projects, and community dialogues. Ready to start? Create your poll and collect data that drives real change.

5 Must-Know Tips to Dodge Pitfalls in Your Urban Suburban Rural survey
Designing an Urban Suburban Rural survey well can make or break policy decisions. A flawed survey misleads stakeholders and wastes resources. Steering clear of the pitfalls below ensures your data supports real impact.
Mistake one: ignoring local context. Rural areas might rely on agriculture, while suburbs juggle commuting. Treating them identically leads to worthless averages. Tailor your questions so each group feels heard.
Mistake two: question overload. When you cram 30 questions into one form, completion rates plunge. Aim for ten thoughtful queries that cover essentials without draining attention. Short, sharp, and focused wins every time.
Mistake three: relying solely on population density. According to the Pew Research Center's work on evaluating what makes a U.S. community urban, suburban or rural, perceptions often diverge from raw numbers. Mix objective measures with perception checks for richer insights.
Mistake four: skipping pilot tests for your sampling scheme. Geographic blind spots leave voices unheard. Use the grid-based sampling approach from A grid-based sample design framework for household surveys to map coverage. Early trials expose gaps you can fix fast.
Words matter. A vague question like "Is your commute efficient?" assumes a car commute. Instead, try "How satisfied are you with your daily travel options, including public transit, biking, or driving?" That specificity cuts bias and boosts clarity.
Watch response trends in real time. If rural responses lag, step up phone or mail outreach as you go. An agile, mid-launch check stops skewed results and keeps your survey on track.
By dodging these common mistakes, you'll compile robust data that informs budgets, zoning, and local services. For deeper insights, launch a Community Development Survey and see your neighborhood's true needs emerge.
Demographic & Lifestyle Questions
Understanding the demographic makeup and lifestyle choices of respondents helps tailor community planning and services. This section draws on insights from the Geographic Demographic Survey to capture key background information.
-
What is your age?
Age is a fundamental demographic factor that influences needs and preferences across urban, suburban, and rural settings.
-
What is your gender?
Gender distribution informs equity analyses and helps ensure services are inclusive for all residents.
-
How many people live in your household?
Household size affects resource use, housing needs, and transportation planning within different areas.
-
What is your current occupation?
Occupation data sheds light on economic activity and commuting patterns in varied geographic contexts.
-
What is the highest level of education you have completed?
Educational attainment correlates with income levels and can guide workforce development strategies.
-
How long have you lived in your current community?
Length of residence can indicate community stability and residents' familiarity with local issues.
-
What was the main reason you chose to live in this area?
Motivations for location choice reveal priorities such as affordability, job access, or lifestyle preferences.
-
How far is your daily commute (in miles or kilometers)?
Commute distance impacts transportation infrastructure needs and quality of life for residents.
-
Which environment do you prefer: urban, suburban, or rural?
Self-reported preference helps planners balance development approaches and service allocation.
-
How frequently do you use the internet at home?
Home internet usage reflects access to digital services and potential for remote work or learning.
Housing & Infrastructure Questions
Assessing housing conditions and infrastructure access is vital for effective community support and development. Insights here align with findings from the Affordable Housing Survey to guide policy decisions.
-
What type of housing do you reside in (e.g., detached house, apartment)?
Housing type influences density measures and infrastructure requirements for water, power, and roads.
-
Do you own or rent your home?
Ownership status affects financial stability, investment in property improvements, and mobility.
-
How satisfied are you with the overall condition of your home?
Satisfaction levels highlight maintenance needs and potential risks to resident well-being.
-
Is your housing affordable based on your income?
Affordability metrics are key indicators of economic pressure and housing security in different areas.
-
How close are essential services (grocery store, hospital) to your home?
Proximity to services determines daily convenience and travel patterns for residents.
-
How reliable are your utilities (water, electricity, gas)?
Utility reliability affects quality of life and can signal infrastructure investment needs.
-
What is the general condition of public roads and sidewalks near you?
Road and sidewalk conditions impact safety, accessibility, and transportation choices.
-
Have you made any home renovations in the last five years?
Renovation activity can reflect investment levels and evolving household requirements.
-
Do you have access to high-speed internet?
Connectivity status is crucial for education, work-from-home capabilities, and telehealth services.
-
Are you planning to move or change your housing situation soon?
Future plans indicate satisfaction trends and potential population shifts in the community.
Transportation & Accessibility Questions
Evaluating how residents travel and access services highlights mobility strengths and gaps. Data here complements the Urban Rural Survey to inform transportation planning.
-
What is your primary mode of transportation?
Identifying dominant transport modes guides infrastructure investment for roads, transit, and cycling.
-
What is your average daily commute time?
Commute duration affects work-life balance and can pinpoint congestion hotspots.
-
How satisfied are you with local public transit options?
Public transit satisfaction reveals gaps in coverage, frequency, or convenience.
-
Rate the quality of local roads and highways.
Road condition ratings signal maintenance needs and safety concerns for drivers and cyclists.
-
Are there sufficient bike lanes or walking paths in your area?
Active-transport infrastructure supports health goals and reduces traffic congestion.
-
How accessible is transportation for individuals with disabilities?
Accessibility scores ensure that everyone can move freely and participate in community life.
-
Do you find parking availability adequate?
Parking availability influences driving habits and the viability of retail districts.
-
How often do you use ride-sharing or car-share services?
Usage rates for shared vehicles reflect shifts in ownership models and urban mobility trends.
-
How convenient is it to reach major employment centers?
Convenience metrics help evaluate connectivity between residential areas and job hubs.
-
What are your average monthly transportation costs?
Cost data supports affordability assessments and can guide subsidy or policy interventions.
Community Engagement & Social Cohesion Questions
Measuring residents' involvement and sense of belonging helps build stronger neighborhoods. This aligns with best practices from the Community Engagement Survey to foster collaboration.
-
How often do you participate in local community events?
Participation frequency indicates the vibrancy of community culture and volunteerism.
-
How well do you know your neighbors?
Familiarity with neighbors fosters trust and mutual support within communities.
-
Do you feel your neighborhood is a welcoming place?
Perceptions of welcome influence newcomer integration and retention rates.
-
How often do you volunteer for community projects?
Volunteer engagement reflects civic pride and the capacity for local initiatives.
-
To what extent do you feel a sense of belonging here?
A strong sense of belonging correlates with mental health and overall satisfaction.
-
Do you have reliable support networks (friends, family) nearby?
Support networks are crucial for resilience during personal or community crises.
-
Are you a member of any local clubs or organizations?
Club membership rates signal opportunities for social interaction and advocacy.
-
How frequently do you socialize with neighbors?
Social interaction frequency strengthens communal bonds and reduces isolation.
-
How satisfied are you with communication from local leaders?
Effective communication builds trust and encourages public participation in governance.
-
Would you recommend this community to others?
Willingness to recommend is a strong indicator of overall community satisfaction.
Environmental Quality & Amenities Questions
Assessing environmental factors and local amenities helps improve public health and well-being. These questions draw on principles from the Good Cities Survey to ensure balanced development.
-
How accessible are parks or green spaces in your area?
Access to green spaces supports recreation, mental health, and environmental stewardship.
-
How would you rate the air quality where you live?
Air quality ratings highlight pollution challenges and public health priorities.
-
How often is noise from traffic or industry a concern?
Noise pollution impacts sleep quality and overall stress levels in neighborhoods.
-
Are streets and public areas kept clean and well-maintained?
Cleanliness contributes to community pride and reduces health hazards.
-
How satisfied are you with public recreation facilities (e.g., pools, sports fields)?
Facility satisfaction indicates investment needs for healthy, active lifestyles.
-
How effective is waste collection and recycling in your community?
Efficient waste management supports sustainability and environmental health.
-
How easily can you access primary healthcare services?
Healthcare accessibility influences overall community resilience and quality of life.
-
Are local grocery stores and markets conveniently located?
Proximity to food retailers affects nutrition and travel patterns for daily needs.
-
How would you rate cultural or entertainment amenities (museums, theaters)?
Cultural amenities enrich community identity and attract visitors or new residents.
-
Overall, how satisfied are you with the environmental quality of your area?
General satisfaction levels provide a holistic view of living conditions and priorities.