Free Always Sometimes Never Survey
50+ Expert Crafted Always Sometimes Never Survey Questions
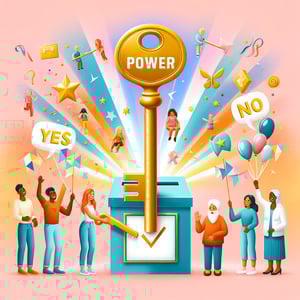
Harness the power of always sometimes never survey questions to reveal the precise frequency of your audience's behaviors and uncover actionable trends. By asking respondents whether they "always," "sometimes," or "never" engage in specific actions, this streamlined survey format delivers clear data on customer habits, employee engagement, or product usage. Load our free template packed with example questions, or visit our online form builder to craft a custom questionnaire in minutes.
Trusted by 5000+ Brands

5 Must-Know Tips to Craft Your Perfect Always Sometimes Never Survey
An always sometimes never survey gives you a clear measure of frequency and nuance in respondents' habits. It's more insightful than a simple yes/no poll and easy to launch with a basic template. Whether you're gauging product usage or team engagement, this design highlights patterns and pain points. Start by exploring our Always Never Survey for a streamlined setup.
Structure each question around a simple stem and three response levels. Experts at Designing Likert scales - TASO recommend cognitive interviewing to ensure respondents interpret "always," "sometimes," and "never" correctly. A sample item might read: "How often do you refer to our user guide?" Always stay attentive to interpretation. This step boosts reliability before you roll out the survey to your audience.
Keep wording clear and balanced. According to What Is a Likert Scale? | Guide & Examples, simple adjectives and equal distance between options reduce bias. Avoid jargon or double-barreled statements. This builds trust and improves completion rates for your always sometimes never survey questions.
Once responses roll in, map "always" to 3, "sometimes" to 2, and "never" to 1 for quick analysis. This straightforward scoring lets you spot trends at a glance. Visualize scores in a bar chart or heatmap to guide decisions. Clean data leads to clear insights.
Imagine your team lead needing feedback on meeting effectiveness. A four-question frequency survey reveals that most people "sometimes" feel heard. You adjust the agenda and see engagement spike. That's the real-world payoff of a well-crafted frequency approach.

What Pros Know About Avoiding Pitfalls in Your Always Sometimes Never Survey
When you set up an always sometimes never survey, avoid ambiguous stems that leave respondents guessing. A vague prompt like "Often useful?" can produce inconsistent answers. Experts at Likert scale survey questions - Definition with examples - Zoho Survey emphasize clear, complete statements. Each question should feel natural and focused, guiding users to choose "always," "sometimes," or "never" without hesitation.
Another mistake is central tendency bias, where respondents overuse the middle option. The Likert scale (Wikipedia) entry warns that this can skew results and mask real opinions. Combat this by randomizing item order or including attention checks. Small tweaks like these boost data accuracy and make your frequency insights sharper.
Skipping a pilot test or cognitive interview is a sure way to miss misinterpretations. Run a quick trial with a handful of volunteers on different devices. You'll catch confusing wording, layout issues, or broken logic before full launch. Investing ten minutes here can save hours of cleaning up messy data later.
Consider a scenario where a marketing team launches a feedback survey without piloting. Half the respondents drop off because the last item wraps awkwardly on mobile screens. Suddenly your sample size shrinks and your findings lose credibility. That pain point is why pre-tests are non-negotiable.
To steer clear of these pitfalls, keep stems concise, balance your response labels, and test early on multiple platforms. For proven templates, explore our Sample Research Survey. Then use a targeted question like "How often do you encounter navigation issues on our dashboard?" to unlock actionable feedback. With these insider tips, your always sometimes never survey will deliver reliable, clear-cut data every time.
Frequency Assessment Questions
This set of questions helps you gauge how often respondents engage in specific activities, providing frequency distribution insights. Use these prompts to identify patterns and trends in behavior for your How Frequently Survey .
-
How often do you use our product to complete daily tasks?
This question uncovers regular usage patterns that inform feature prioritization. It helps identify peak usage times and critical touchpoints.
-
How frequently do you check notifications on our platform?
Measuring notification checks indicates engagement levels. The data guides optimization of alert timing and relevance.
-
How often do you participate in our community forums?
This question gauges community involvement. It supports strategies to boost user-generated content.
-
How many times per week do you access customer support?
Tracking support requests reveals potential pain points. Insights drive improvements in self-service resources.
-
How often do you update your profile information?
This question identifies user commitment to personalization. It assists in designing prompts for profile completeness.
-
How frequently do you use advanced features?
Assessing advanced feature usage shows adoption rates. It helps allocate training and development resources.
-
How often do you open our email newsletters?
Email open frequency reflects content relevance. This guides newsletter formatting and scheduling.
-
How frequently do you log into your account?
Login patterns reveal active user base. It informs retention strategies and churn prevention.
-
How often do you share our content with others?
Share frequency measures advocacy and virality potential. It helps tailor social media campaigns.
-
How often do you switch between different devices when using our service?
Device switching frequency highlights cross-platform needs. It informs responsive design and testing priorities.
Behavior Insight Questions
Behavior Insight Questions offer a deeper look into respondent actions and decisions. Incorporate these prompts in your General Information Survey to capture meaningful behavioral data and inform targeted improvements.
-
How often do you read product documentation before use?
Assessing documentation review habits reveals training needs. It supports improvements in user guides.
-
How frequently do you customize your dashboard settings?
This question measures personalization behavior. It indicates which customization options are most valued.
-
How often do you abandon a task before completion?
Tracking task abandonment highlights usability issues. It helps streamline workflows.
-
How frequently do you try new features upon release?
Feature adoption frequency shows user openness to change. It guides communication strategies for updates.
-
How often do you compare our service with competitors?
Competitive comparison frequency indicates customer satisfaction. It helps position unique selling points.
-
How often do you refer to online tutorials or help resources?
This question assesses self-help behavior. It informs the need for additional training materials.
-
How frequently do you escalate issues to higher support tiers?
Escalation rates reveal complexity of user problems. It assists in improving frontline support capabilities.
-
How often do you recommend our service to a colleague?
Recommendation behavior measures Net Promoter potential. It guides referral program design.
-
How frequently do you provide feedback or suggestions?
Feedback frequency shows engagement with product development. It helps prioritize feature requests.
-
How often do you participate in beta testing?
Beta participation rates reflect user interest in innovation. It informs beta program outreach and management.
Satisfaction Evaluation Questions
Satisfaction Evaluation Questions measure how respondents feel about services, products, or experiences. Embed these in your Multiple Choice Survey to collect nuanced feedback and drive customer-centric enhancements.
-
How often are you satisfied with our customer service?
This question tracks overall support satisfaction. It helps identify areas needing service training.
-
How frequently are product updates meeting your expectations?
Measuring update satisfaction shows product roadmap alignment. It guides prioritization of future releases.
-
How often do you find our pricing fair?
Price fairness frequency reveals perceived value. It assists in pricing strategy adjustments.
-
How frequently are you satisfied with our user interface?
UI satisfaction frequency indicates design effectiveness. It supports UI/UX refinement efforts.
-
How often do you feel supported during onboarding?
Onboarding satisfaction frequency measures initial experience. It helps enhance training and orientations.
-
How often are you satisfied with our reporting features?
Reporting satisfaction frequency indicates feature utility. It guides reporting tool improvements.
-
How frequently are you happy with the speed of our service?
Speed satisfaction frequency reveals performance perceptions. It informs infrastructure scaling decisions.
-
How often do you feel our platform is reliable?
Reliability satisfaction frequency tracks downtime tolerance. It supports SLAs and maintenance planning.
-
How frequently are you pleased with our mobile app experience?
Mobile satisfaction frequency measures app quality. It guides mobile development priorities.
-
How often do you feel our product enhances your productivity?
Productivity satisfaction frequency shows ROI perceptions. It aids in marketing value propositions.
Preference Trend Questions
Preference Trend Questions reveal shifting likes and dislikes over time, guiding product development and marketing strategies. Leverage these in your Survey Topic Questions Survey for trend analysis and forecasting.
-
How often do you prefer using feature A over feature B?
This question captures comparative preferences. It helps allocate development resources effectively.
-
How frequently do you choose mobile over desktop for tasks?
Device preference trends inform platform prioritization. It aids in resource allocation for responsive design.
-
How often do you prefer email updates to in-app notifications?
Communication mode preferences guide messaging strategies. It ensures higher engagement rates.
-
How frequently do you opt for manual over automated processes?
Process preference trends reveal trust levels. It helps balance automation and control.
-
How often do you prefer live chat to phone support?
Support channel preference trends inform service provisioning. It shapes customer service policies.
-
How frequently do you choose standard over premium features?
Feature tier preferences guide pricing models. It informs package development and bundling.
-
How often do you prefer video tutorials to written guides?
Learning mode preferences drive training content strategy. It enhances educational resource design.
-
How frequently do you favor self-service options over agent assistance?
Self-service preference trends identify automation opportunities. It reduces support costs.
-
How often do you prefer community forums to direct support?
Peer-to-peer support preferences inform community management. It fosters user engagement.
-
How frequently do you choose to save drafts instead of immediate submission?
Draft usage trends highlight workflow flexibility needs. It improves form design and user experience.
Habit Tracking Questions
Habit Tracking Questions help track ongoing routines and repetitive actions, useful for lifestyle or health research. Include these in your Sample Research Survey to identify and monitor behavioral habits.
-
How often do you check your goals or progress trackers?
This question monitors goal engagement frequency. It supports progress visualization improvements.
-
How frequently do you log your activity or time spent?
Activity logging frequency uncovers tracking habits. It informs design of logging features.
-
How often do you set new objectives for yourself?
Objective-setting frequency indicates motivation levels. It helps tailor motivational prompts.
-
How frequently do you review past entries or history logs?
Review habits reveal reflection practices. It guides enhancement of history review tools.
-
How often do you adjust your routine based on results?
Routine adjustment frequency measures adaptability. It informs feedback loop designs.
-
How frequently do you share your progress with others?
Sharing frequency reflects accountability behaviors. It helps integrate social features.
-
How often do you reward yourself after completing a milestone?
Reward habits indicate reinforcement strategies. It helps design gamification elements.
-
How frequently do you experience lapses in your routine?
Lapse frequency reveals consistency challenges. It informs support for habit retention.
-
How often do you seek reminders or notifications for tasks?
Reminder usage frequency highlights reliance on prompts. It aids in notification system optimization.
-
How frequently do you track related metrics manually?
Manual tracking frequency measures automation needs. It guides integration of automated tracking options.
Engagement Analysis Questions
Engagement Analysis Questions evaluate levels of participation, interest, and involvement across various contexts. Use these prompts to enhance your Random Question Survey for a comprehensive view of engagement metrics.
-
How often do you engage with our weekly webinars?
Webinar engagement frequency measures educational interest. It helps refine session topics and scheduling.
-
How frequently do you comment on blog posts or articles?
Comment frequency indicates content engagement. It guides editorial strategy and community building.
-
How often do you respond to in-app surveys or polls?
Survey engagement frequency shows willingness to provide feedback. It informs survey placement and timing.
-
How frequently do you attend live events or meetups?
Event attendance trends highlight community involvement. It informs event planning and promotion.
-
How often do you click on promotional banners?
Banner click frequency measures ad effectiveness. It guides design and placement of promotional content.
-
How frequently do you explore new product announcements?
Announcement exploration frequency reveals curiosity levels. It helps tailor launch communications.
-
How often do you invite colleagues to join our platform?
Invitation frequency indicates referral potential. It supports advocacy and referral program development.
-
How frequently do you download our mobile app updates?
Update download frequency reflects user commitment. It informs version release strategies.
-
How often do you engage with our tutorial videos?
Tutorial engagement frequency assesses learning resource utilization. It aids in multimedia content planning.
-
How frequently do you interact with our AI chatbot feature?
Chatbot interaction frequency measures the value of AI assistance. It guides chatbot training and feature enhancements.