Reporting - Poll Help
Printing reports to PDF / Paper
- Login to your account, select the poll you wish to report on from your Polls List and click the ' Results' Button
- Find and click the 'Print' button on your Browser
- If you want to print to PDF and you are using the Chrome browser then simply change the 'Destination' to 'Save as PDF'. In other browsers you can download free Print to PDF extensions (eg: Cute PDF) - install one of those first.
- In the print preview the page will automatically change to a print ready document - you may need to tick "Background Graphics" to see the report best
You can also print individual votes to your Poll, and Print the Poll itself.
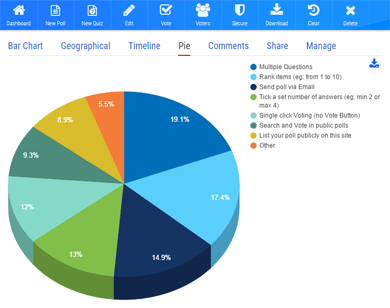
Viewing the vote Pie Chart
You can view the voting Pie chart from within your Account Results by clicking on the blue 'Pie' link at the top of your report.
The pie chart shows the total distribution of your votes as percentages of the total amount of votes. There is also a key in the top right that shows what each color in the pie represents. You can hover your mouse over each pie segment to see what it is and the percentage and vote number it represents.
By default the answers are sorted from most to least popular in your pie chart.
Download the Pie Chart
Click the blue download button in the top right of the Pie Chart to save it as an image to your local computer (for use in presentations etc...).
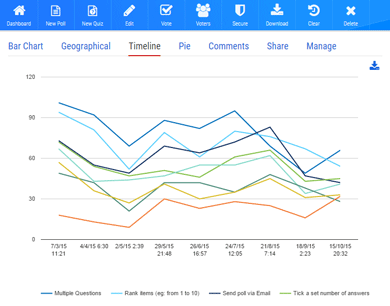
Viewing the voting Time Line
You can view the voting Time Line from within your Account Results by clicking on the blue 'Timeline' link at the top of your report.
This graph shows how the votes for your poll have been distributed over time - the time scale automatically adjusts based on how long the poll has been active and 1 point on the time (X) axis does not always represent 1 day or 1 hour.
There is a key at the bottom of your time line that shows which color in the graph represents which answer in your poll.
Download the Time Line
Click the blue download button in the top right of the Time Line to save it as an image to your local computer (for use in presentations etc...).
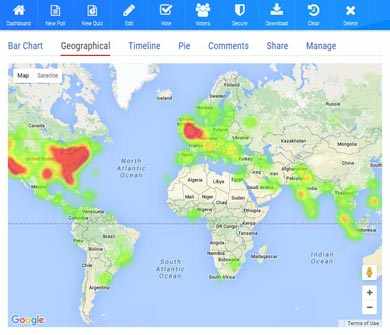
Viewing the response Map
You can view the response Location Heat Map from within your Account Results by clicking on the blue 'Geographical' link at the top of your report.
This map shows the intensity of responses from each region of the world. Red indicates a large amount of responses, yellow indicates a moderate amount of responses and green indicates few responses. You can zoom in and out of the map with the vertical drag bar on the left of the map, and you can click and drag to move around the map.
Download the Map
Currently the only way to download a copy of the map is to use a Screen Capture.
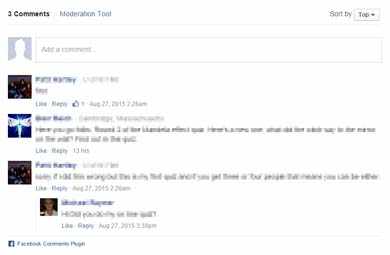
Viewing your Comments
You can view your poll comments from within your Account Results by clicking on the blue 'Comments' link at the top of your report. This will show the Facebook Comments box and you can review the comments and/or add comments.
Moderating Comments
Unfortunately it is not possible to moderate the comments, however you can report inappropriate, offensive or spam comments to Facebook by hovering over the comment and selecting the down arrow that appears to the right of the comment.
Select 'Flag comment' or 'Report to Facebook' and follow the Facebook prompts (you will need to login to Facebook).